New commands
last modified: 2024-01-20 by Kodai OkawaVarious commands (mainly the same with ANAPAW commands) have been developed for CRIB experiment. For more information, please click here (src-crib/commands). These commands are registered in userlogon.C. (See previous section.)
This section explains how to use them.
- start
- stop
- xfitg
- xblow
- xyblow
- xstatus
- tcutg
- erase
- draw
the default figures:

start
This is exactly the same as the resume command, because ANAPAW starts the event loop with start instead of resume.
stop
This is exactly the same as the suspend command, because ANAPAW stops the event loop with stop instead of suspend.
xfitg
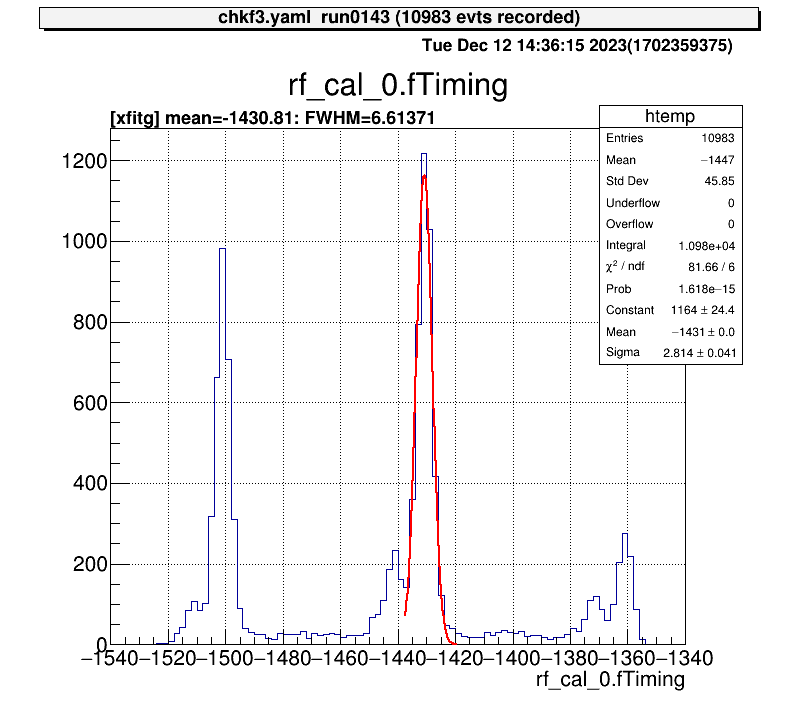
For 1D histograms, by selecting the two ends of two points, the peak between them is fitted with a Gaussian.
artemis [7] xf
Info in <art::TCmdXfitg::Cmd>: click on the lowest edge:
Info in <art::TCmdXfitg::Cmd>: click on the highest edge:
Info in <art::TCmdXfitg::Cmd>: X1: -1437.56, X2: -1419.11
 FCN=81.6642 FROM MIGRAD    STATUS=CONVERGED      71 CALLS          72 TOTAL
                     EDM=3.35095e-09    STRATEGY= 1      ERROR MATRIX ACCURATE
  EXT PARAMETER                                   STEP         FIRST
  NO.   NAME      VALUE            ERROR          SIZE      DERIVATIVE
   1  Constant     1.16439e+03   2.43862e+01   8.08454e-02   9.04256e-07
   2  Mean        -1.43081e+03   4.54001e-02   6.82262e-04  -1.74034e-03
   3  Sigma        2.81435e+00   4.07888e-02   1.55351e-05  -3.15946e-03
artemis [8]
xblow
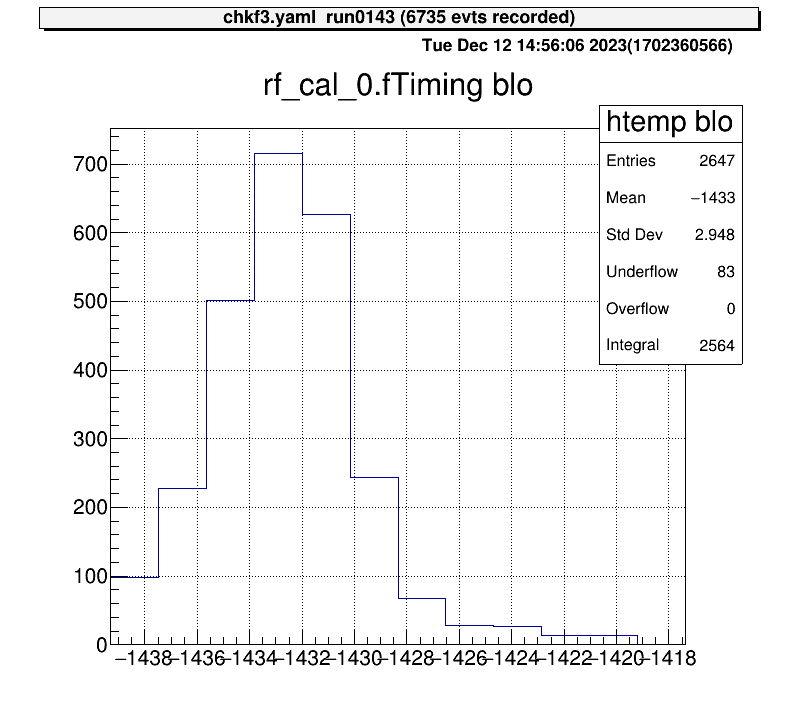
For 1D histograms, select both ends and crop the histogram between them.
artemis [10] xblo
Info in <art::TCmdXblow::Run>: click on the lowest edge:
Info in <art::TCmdXblow::Run>: click on the highest edge:
Info in <art::TCmdXblow::Run>: X1: -1439.3, X2: -1417.37
Info in <art::TCmdXblow::Run>: id = 2 hist is created
artemis [11]
xyblow
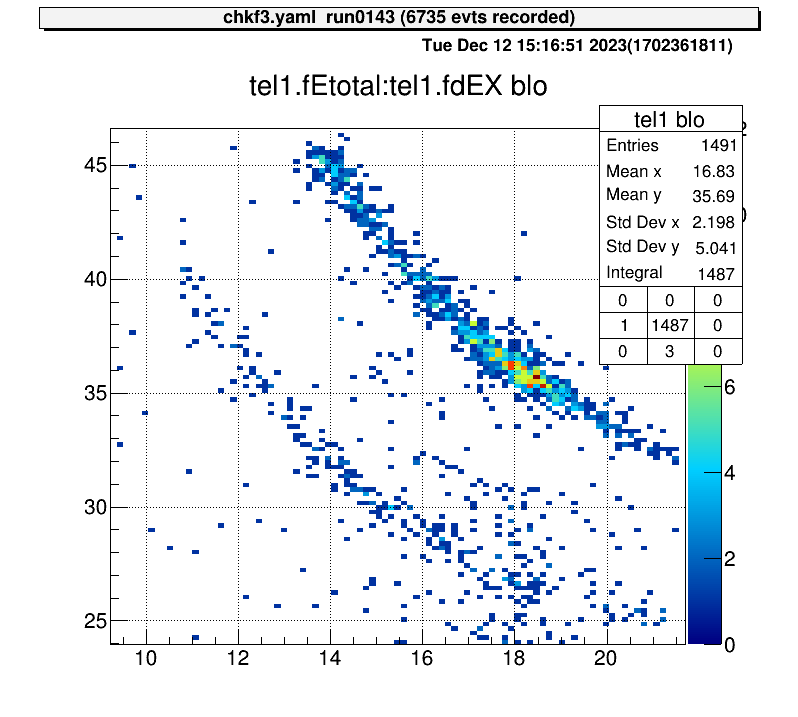
For 2D histograms, select both corners and crop the histogram between them.
artemis [60] xyblo
Info in <art::TCmdXYblow::Run>: click on one corner:
Info in <art::TCmdXYblow::Run>: X1: 9.2154, Y1: 46.6159
Info in <art::TCmdXYblow::Run>: click on the other corner:
Info in <art::TCmdXYblow::Run>: X2: 21.7032, Y2: 23.952
Info in <art::TCmdXYblow::Run>: id = 6 hist is created
artemis [61]
xstatus
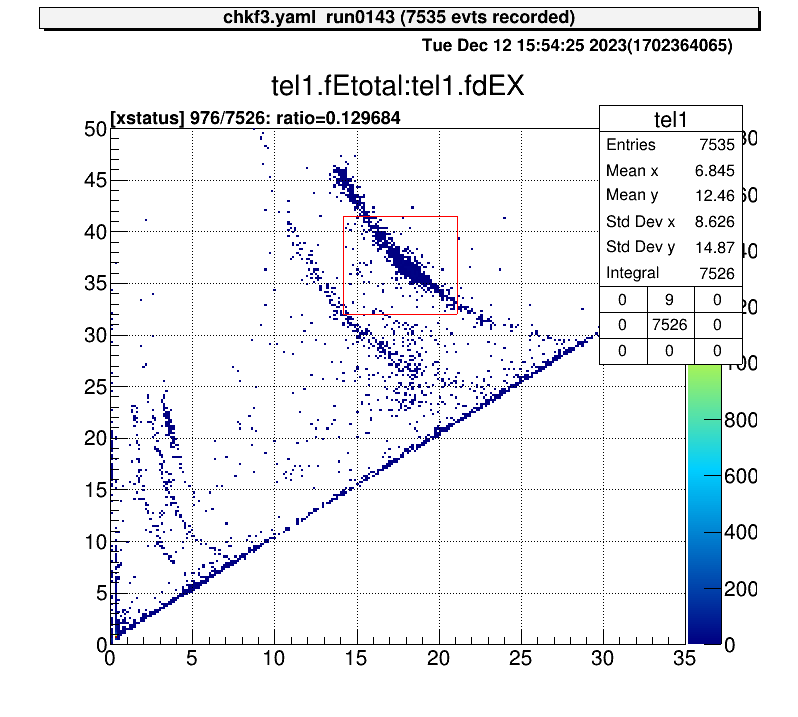
For 2D histograms, select both corners and determine the ratio of the total number of events.
artemis [8] xs
Info in <art::TCmdXstatus::Cmd>: click on one corner:
Info in <art::TCmdXstatus::Cmd>: X1: 14.1496, Y1: 41.4826
Info in <art::TCmdXstatus::Cmd>: click on the other corner:
Info in <art::TCmdXstatus::Cmd>: X2: 21.0941, Y2: 31.9909
------------------
selected = 976, total = 7526
ratio  = 0.129684 (12.9684%)
artemis [9]
tcutg
For 2D histograms, this command create TCutG object and store in a ROOT file.
If you select to save the object, the file will place to the gate/*.root directory.
There objects are automatically loaded. (please check user config page.)
This is the example how to use this command.
artemis [] ht something
artemis [] tc
Info in <TCatCmdTCutG::Cmd>: Xaxis name : f2ppac.fX  Yaxis name : f2ppac.fY
Info in <TCatCmdTCutG::Cmd>: When you have finished specifying the area (last point), double-click on it.
Info in <TCatCmdTCutG::Cmd>: (x, y) = (9.050404, 10.301410)
Info in <TCatCmdTCutG::Cmd>: (x, y) = (5.047341, -8.294592)
Info in <TCatCmdTCutG::Cmd>: (x, y) = (-12.183236, -3.839300)
Info in <TCatCmdTCutG::Cmd>: (x, y) = (3.306878, -15.074384)
Info in <TCatCmdTCutG::Cmd>: (x, y) = (-3.306878, -32.120720)
Info in <TCatCmdTCutG::Cmd>: (x, y) = (9.920635, -15.461801)
Info in <TCatCmdTCutG::Cmd>: (x, y) = (18.274854, -29.989928)
Info in <TCatCmdTCutG::Cmd>: (x, y) = (16.186299, -11.200217)
Info in <TCatCmdTCutG::Cmd>: (x, y) = (35.157338, -4.420425)
Info in <TCatCmdTCutG::Cmd>: (x, y) = (14.271791, -4.807841)
Info in <TCatCmdTCutG::Cmd>: (x, y) = (10.964912, 9.332869)
Info in <TCatCmdTCutG::Cmd>: (x, y) = (10.964912, 9.332869)
if you want to save it, input the TCutG name [name/exit] f2star
Info in <TCatCmdTCutG::Cmd>: Created gate/f2star.root
To select an area, click on the vertices of the area you want to select, then double-click at the last vertex.
If you want to save this object, enter the “cut” name.
In this example, I input the f2star as the object name.
If you don’t want to save, enter “exit”.
Then the gate/f2star.root will be created.
And after reload the artemis, the gate will be loaded automatically and we can use histogram definition and “tree->Draw” selection part.
For the detail please check gate page.
artemis [] tree->Draw("f2ppac.fY:f2ppac.fX>>(200,-50.,50., 200,-50.,50.)","f2star","colz")